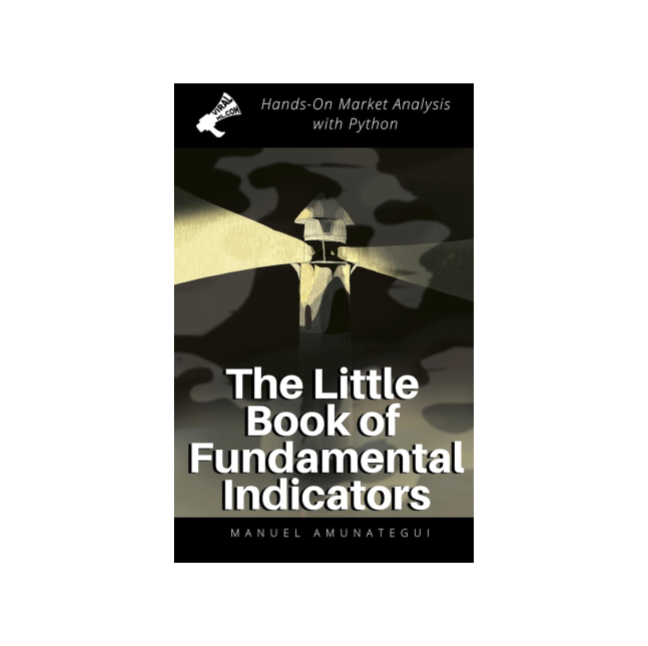
My New Book: "The Little Book of Fundamental Analysis: Hands-On Market Analysis with Python" is Out!
Introduction
Im extremely excited to announce my new book that is now available on Amazon - entitled The Little Book of Fundamental Indicators: Hands-On Market Analysis with Python. Let me give you a brief review of what to expect. MORE: Blog or code: http://www.viralml.com/video-content.html?fm=yt&v=yIa6bu10C5g Signup for my newsletter and more: http://www.viralml.com Connect on Twitter: https://twitter.com/amunategui Check out my book on Amazon The Little Book of Fundamental Market Indicators https://amzn.to/2DERG3d Transcript Hello Friends, Im extremely excited to announce my new book that is now available on Amazon - entitled The Little Book of Fundamental Indicators: Hands-On Market Analysis with Python Let me give you a brief review of what to expect. This book is about my favorite fundamental indicators. I describe them, tell you where to download the data for free, and, of course, how to visualize them. Each chapter comes with a downloadable Jupyter notebook extract. These represent the basic yet critical sources of information that anybody interested in the markets should know. All you need is financial curiosity, a desire to roll up your sleeves, get your own answers and basic knowledge of python - from there, you will finally be able to find your bearings and not rely on the opinion of others such as newscasts or newspapers or pundits. Ill start with the most important of all, the granddaddy of indexes, the S&P 500. This is a powerhouse of a financial indicator - it captures over 80% of the total equity market value traded in the United States and 30% of its revenue comes from outside the United States, this makes it the electrocardiogram of the financial markets of the world. Every other financial product out there is measured against this one. Well look at the VIX the fear index, to give us a feel of how people are positioning themselves for the future. Yield Curve and how to spot when it is inverted, Case-Shiller Home Price Index to know whats going on real estate Ill show you how to create a custom index made up of a basket of stocks of your choice. and much more! A bit about me, this book is the cumulation my experience, Ive traded quantitatively for a few years, worked on a trading desk on wall street for 6 years and have been a data scientist for almost 10 years now analyzing data and building models in finance, healthcare, production automation, and advertising. That said, it is often the simplest things that are the most powerful, and because they are simple anybody can understand them and leverage for their own benefit. I will not be talking about trading, showing trading setups, or giving financial advice, on the contrary, I will be showing you the tools to empower you to make up your own mind, answer your own questions, and decide what to do with this information. 1. Downloading Market Data from Yahoo Finance 2. S&P 500 - Visualization with Candlesticks 3. Enhancing Market Charts with Background Colors 4. VIX - The Fear Index 5. The Inverted Yield Curve 6. S&P Case-Shiller Home Price Index - Whats Going on in Real Estate? 7. Transportation as a Leading Indicator of Trouble? 8. Exploring Unemployment Numbers 9. Build a Custom Stock Market Index - Tracking Teenage Spending Habits 10. Dividends and The Dividend Yield - Are You More of a Growth or Income Investor? 11. A Look at Inflation 12. Bankruptcies in the US 13. Retail Numbers - Leading or Lagging Indicator? 14. Bogleheads Investment Philosophy Thanks, and please share this video with others you think could benefit from having the tools to analyze the markets for themselves! CATEGORY:Books
Code
If there is code for this video, please refer to YouTube notes
Show Notes
(pardon typos and formatting -these are the notes I use to make the videos)
Im extremely excited to announce my new book that is now available on Amazon - entitled The Little Book of Fundamental Indicators: Hands-On Market Analysis with Python. Let me give you a brief review of what to expect. MORE: Blog or code: http://www.viralml.com/video-content.html?fm=yt&v=yIa6bu10C5g Signup for my newsletter and more: http://www.viralml.com Connect on Twitter: https://twitter.com/amunategui Check out my book on Amazon The Little Book of Fundamental Market Indicators https://amzn.to/2DERG3d Transcript Hello Friends, Im extremely excited to announce my new book that is now available on Amazon - entitled The Little Book of Fundamental Indicators: Hands-On Market Analysis with Python Let me give you a brief review of what to expect. This book is about my favorite fundamental indicators. I describe them, tell you where to download the data for free, and, of course, how to visualize them. Each chapter comes with a downloadable Jupyter notebook extract. These represent the basic yet critical sources of information that anybody interested in the markets should know. All you need is financial curiosity, a desire to roll up your sleeves, get your own answers and basic knowledge of python - from there, you will finally be able to find your bearings and not rely on the opinion of others such as newscasts or newspapers or pundits. Ill start with the most important of all, the granddaddy of indexes, the S&P 500. This is a powerhouse of a financial indicator - it captures over 80% of the total equity market value traded in the United States and 30% of its revenue comes from outside the United States, this makes it the electrocardiogram of the financial markets of the world. Every other financial product out there is measured against this one. Well look at the VIX the fear index, to give us a feel of how people are positioning themselves for the future. Yield Curve and how to spot when it is inverted, Case-Shiller Home Price Index to know whats going on real estate Ill show you how to create a custom index made up of a basket of stocks of your choice. and much more! A bit about me, this book is the cumulation my experience, Ive traded quantitatively for a few years, worked on a trading desk on wall street for 6 years and have been a data scientist for almost 10 years now analyzing data and building models in finance, healthcare, production automation, and advertising. That said, it is often the simplest things that are the most powerful, and because they are simple anybody can understand them and leverage for their own benefit. I will not be talking about trading, showing trading setups, or giving financial advice, on the contrary, I will be showing you the tools to empower you to make up your own mind, answer your own questions, and decide what to do with this information. 1. Downloading Market Data from Yahoo Finance 2. S&P 500 - Visualization with Candlesticks 3. Enhancing Market Charts with Background Colors 4. VIX - The Fear Index 5. The Inverted Yield Curve 6. S&P Case-Shiller Home Price Index - Whats Going on in Real Estate? 7. Transportation as a Leading Indicator of Trouble? 8. Exploring Unemployment Numbers 9. Build a Custom Stock Market Index - Tracking Teenage Spending Habits 10. Dividends and The Dividend Yield - Are You More of a Growth or Income Investor? 11. A Look at Inflation 12. Bankruptcies in the US 13. Retail Numbers - Leading or Lagging Indicator? 14. Bogleheads Investment Philosophy Thanks, and please share this video with others you think could benefit from having the tools to analyze the markets for themselves! CATEGORY:Books


