Charting Financial Markets Objectively with Python and Matplotlib during Trying Times - Hands-on
Introduction
It is easy to chart the markets with Python and great data sources like Yahoo Finance. Let's look at airline ETFs, the VIX, the S&P500, Johnson and Johnson and more! Get your own answers to your questions without having to rely on the Internet, newspapers and TV. Avoid the emotions and the drama and get your own objective answers.
Code
from IPython.display import Image
Image(filename='viralml-book.png')
Getting Your Market Bearings in Turbulent Times with Python
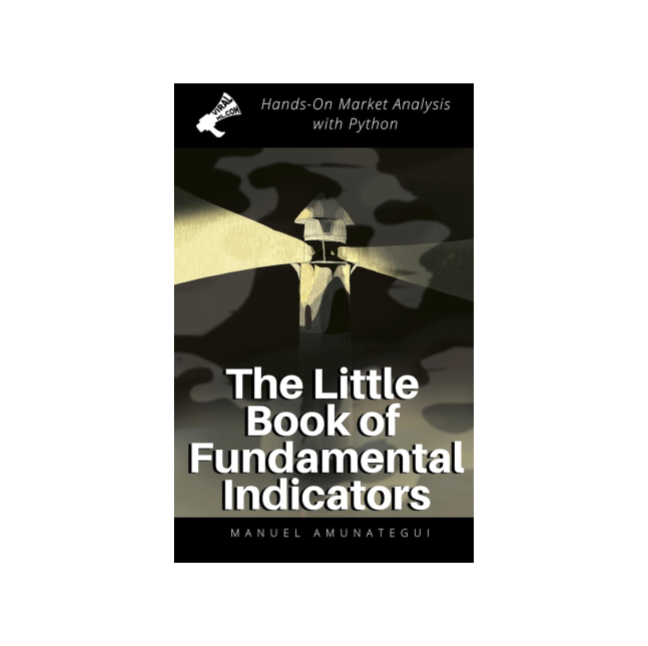
Companion book: "The Little Book of Fundamental Market Indicators":
More at:
The Boeing Company
The Boeing Company (BA)
Airline ETFs
iShares Transportation Average ETF: IYT
U.S. Global Jets ETF: JETS
Healthcare/Chemicals ETFs
iShares U.S. Healthcare Providers ETF: IHF
Johnson & Johnson (owns Purell/Pfizer): JNJ
VIX - The Fear Index
Download the S&P500 index (^GSPC): https://finance.yahoo.com/quote/%5EGSPC/
and the VIX (^VIX): https://finance.yahoo.com/quote/%5EVIX
%matplotlib inline
import matplotlib
import matplotlib.pyplot as plt
import pandas as pd
import numpy as np
import datetime
path_to_market_data = '/Users/manuel/Documents/financial-research/market-data/2020-03-11/'

sp500_df = pd.read_csv(path_to_market_data + '^GSPC.csv')
sp500_df['Date'] = pd.to_datetime(sp500_df['Date'])
sp500_df = sp500_df.sort_values('Date', ascending=True)
sp500_df.tail()
Load The VIX and the S&P 500 Historical Data
vix_df = pd.read_csv(path_to_market_data + '^VIX.csv')
vix_df['Date'] = pd.to_datetime(vix_df['Date'])
vix_df.tail()
# date range available
print('VIX:', np.min(vix_df['Date']), np.max(vix_df['Date']))
# date range available
print('SP500:', np.min(sp500_df['Date']), np.max(sp500_df['Date']))
# cut off data for visualization
cut_off_date = '2016-01-01'
sp500_df = sp500_df[sp500_df['Date'] >= cut_off_date]
vix_df = vix_df[vix_df['Date'] >= cut_off_date]
Simple Visualization with the S&P 500 & VIX
fig, ax = plt.subplots(figsize=(16, 8))

plt.plot(vix_df['Date'], vix_df['Adj Close'], color='blue', label='VIX')
ax.legend(loc='upper left', frameon=False)
plt.title('VIX and S&P 500')
plt.grid()

# Get second axis
ax2 = ax.twinx()
plt.plot(sp500_df['Date'],
         sp500_df['Adj Close'], label='S&P500', color='green')
ax2.legend(loc='lower right', frameon=False)

plt.show()
Let's clean this up with a rolling average
fig, ax = plt.subplots(figsize=(16, 8))
plt.plot(vix_df['Date'], vix_df['Adj Close'].rolling(window=20).mean().values,
         color='blue', label='VIX')
ax.legend(loc='upper left', frameon=False)
plt.title('VIX and S&P 500')
plt.grid()
plt.axhline(15, color='red')


# Get second axis
ax2 = ax.twinx()
plt.plot(sp500_df['Date'],
         sp500_df['Adj Close'], label='S&P500', color='green', linewidth=5)
ax2.legend(loc='lower right', frameon=False)

plt.show()

fig, ax = plt.subplots(figsize=(16, 4))
ax.bar(sp500_df['Date'], sp500_df['Volume'] ,color='black', width=2, label='Hist')
ax.axhline(y=0)
plt.grid()


plt.show()
Transportation
iyt_df = pd.read_csv(path_to_market_data + 'IYT.csv')
iyt_df['Date'] = pd.to_datetime(iyt_df['Date'])
iyt_df.head()
jets_df = pd.read_csv(path_to_market_data + 'JETS.csv')
jets_df['Date'] = pd.to_datetime(jets_df['Date'])
jets_df.head()
# cut off data for visualization
cut_off_date = '2016-01-01'
jets_df = jets_df[jets_df['Date'] >= cut_off_date]
iyt_df = iyt_df[iyt_df['Date'] >= cut_off_date]
fig, ax = plt.subplots(figsize=(16, 8))
plt.plot(iyt_df['Date'], iyt_df['Adj Close'], color='blue', label='IYT')
ax.legend(loc='upper left', frameon=False)
plt.title('IYT and JETS')
plt.grid()

# Get second axis
ax2 = ax.twinx()
plt.plot(jets_df['Date'],
         jets_df['Adj Close'], label='JETS', color='green')
ax2.legend(loc='lower right', frameon=False)

plt.show()
ba_df = pd.read_csv(path_to_market_data + 'BA.csv')
ba_df['Date'] = pd.to_datetime(ba_df['Date'])
ba_df = ba_df[ba_df['Date'] >= '2010-01-01']
fig, ax = plt.subplots(figsize=(16, 8))
plt.plot(ba_df['Date'], ba_df['Adj Close'], color='black', label='BA')
ax.legend(loc='upper left', frameon=False)
plt.title('BA')
plt.grid()


fig, ax = plt.subplots(figsize=(16, 4))
ax.bar(ba_df['Date'], ba_df['Volume'] ,color='blue', width=2, label='Hist')
ax.axhline(y=0)
plt.grid()
Healthcare
ihf_df = pd.read_csv(path_to_market_data + 'IHF.csv')
ihf_df['Date'] = pd.to_datetime(ihf_df['Date'])
ihf_df.head()
jnj_df = pd.read_csv(path_to_market_data + 'JNJ.csv')
jnj_df['Date'] = pd.to_datetime(jnj_df['Date'])
jnj_df.head()
# cut off data for visualization
cut_off_date = '2016-01-01'
ihf_df = ihf_df[ihf_df['Date'] >= cut_off_date]
jnj_df = jnj_df[jnj_df['Date'] >= cut_off_date]
fig, ax = plt.subplots(figsize=(16, 8))
plt.plot(ihf_df['Date'], ihf_df['Adj Close'], color='blue', label='IHF')
ax.legend(loc='upper left', frameon=False)
plt.title('IHF and JNJ')
plt.grid()

# Get second axis
ax2 = ax.twinx()
plt.plot(jnj_df['Date'],
         jnj_df['Adj Close'], label='JNJ', color='green')
ax2.legend(loc='lower right', frameon=False)

plt.show()
Show Notes
(pardon typos and formatting -these are the notes I use to make the videos)
It is easy to chart the markets with Python and great data sources like Yahoo Finance. Let's look at airline ETFs, the VIX, the S&P500, Johnson and Johnson and more! Get your own answers to your questions without having to rely on the Internet, newspapers and TV. Avoid the emotions and the drama and get your own objective answers.


