Hey, Analysts, Stop Being Selfish! Share your Magic and Change the World!
Push your Data-Driven Pet Project to the Web Today

Hello, data people! Do we have anything in common with tarot readers, tea leaf readers, dowsers, or astrologers? A lot of us will say no, and I agree but I’ll also agree to a less obvious difference. They use data and aim to offer actionable insight. Most of it may be based on dubious science and the actionable part may not be much more than entertainment, but at least they systematically dig for data and share. A lot of us in the “real” data world, don’t.
How many of us selfishly reserve those magic skills for boring corporate end-of-month reports that nobody reads or hunker down in our cubicles and never think outside the box?
Transforming data into actionable intelligence can have a positive effect on may people around the world. I know you have those skills and you probably have a pet project or two you’d love to share with the world— like a health or money management app, a hobby system, a career-boosting portal, whatever. The point is we have these incredible skills in a very well paid field, we owe it to others to give back.
Let me show you how easy it is to get a pet project off the ground and catapulted into the hands of everyday people and on the cheap.
We’ll break it down into these 5 overarching steps:
- Idea
- Data/Exploratory Data Analysis (EDA)
- Algorithm Research/Modeling
- Functional Abstraction
- Web UI Design/Cloud Deployment
Predicting Life Expectancy
Phase 1: Idea
The idea phase is critical. You have to make sure you have the resources to build it (whether yourself or your customer), the expertise to guide and answer questions, and that there is a big enough audience for the end product. There is no worse feeling than spending all this time building something just to see it languish unused.
I’ll show you an example of a health awareness web application. The idea is to create a simple web app where anybody can get a life expectancy prediction in units of number-of-years-left-to-live by entering their age, gender, and location. This is not only a fun tool introducing basic statistics but also a wake-up call for people my age to make every minute count!
Phase 2: Data/EDA
Data is key, it’s the fuel to any data-driven application. If it doesn’t exist, then the level of difficulty for your app, just doubled and you’re going to have to figure out how to collect it. Thankfully, we will use data from the WHO, the World Health Organization, that graciously offers accurate mortality datasets with tons of history. You can find more information on the Global Health Observatory (GHO) page.

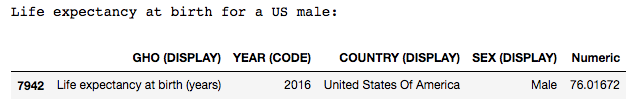
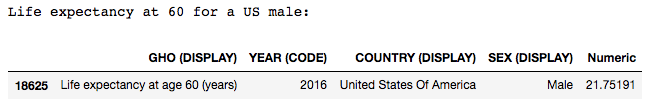
Part of the EDA is to explore the data and make sure we have everything we need to offer accurate data and/or to properly train a model. Let’s pull an example for the WHO data, a US male at birth and at 60 years old. An interesting side note is to observe the difference between expected life. At birth, he is estimated to live a total of 76 years, while at 60, a total of 82 years. Nope, it’s not a drastic fall in life expectancy in the US but good old survivorship bias. That newborn has a lot of years and obstacles to survive before getting to 60 and that pulls the average down.
Phase 3: Algorithm Research/Modeling
This is the fun part and, if you do this right, the part where you’ll spend the least amount of time in this entire pipeline (if this isn’t the case then you may need to re-evaluate things).
We’ll rely on only two data points for each country and gender to extrapolate the number of years left to live. This is easily done with a simple linear regression.
Let’s look at an example:
We have two sets of coordinates so we can easily plot this on a two-dimensional chart and extrapolate what a 20-year-old can expect:
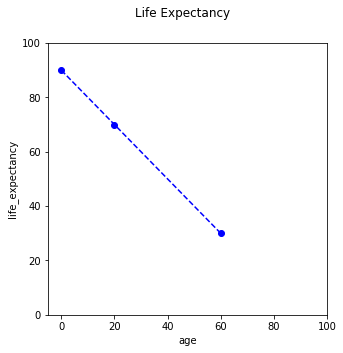
It should now be easy to visualize how we can estimate life expectancy using unknown ages by picking any point along the blue line. We can also do this quantitatively using the slope and intercept of the line and the y = mx+b line equation.
Life Expectancy Estimate = Slope * Age + Intercept
Phase 4: Functional Abstraction
Now that we have our formula ready to go, we need to abstract and shrink it down into the minimum needed moving parts and wrap it all into a neat function. Remember, the final product won’t be inside of a Jupyter notebook but on a web server in the cloud. This is easily done using Python and Flask as they both share the same programming language and have unobstructed access to each other. That and the fact that Python is such a simple and pleasurable language to program with.
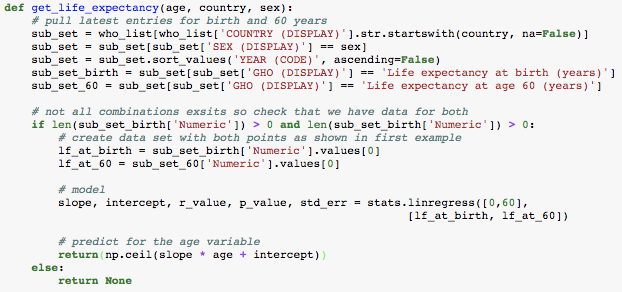
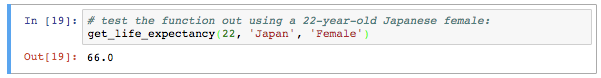
The entire pet project is now reduced into a simple Python function. All we need to do is pass it is an age, a country, and a gender, and we’ll get an estimate.
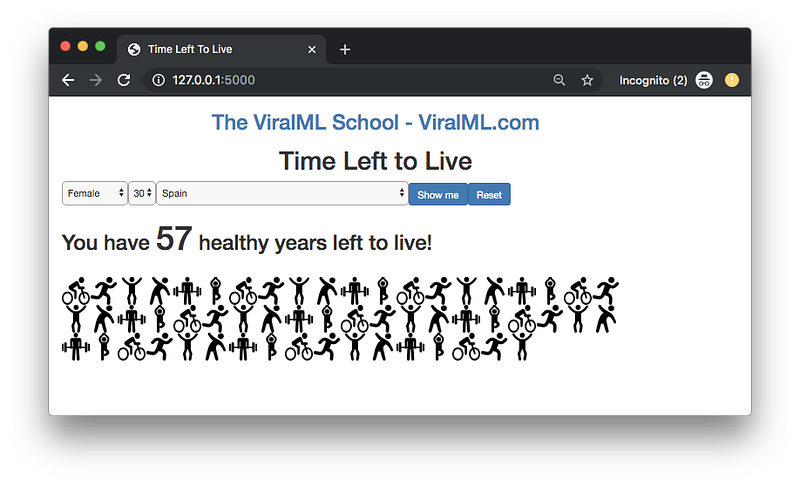
Phase 5: Web UI Design/Cloud Deployment
We’ve arrived at the last stage! This is a critical one. We need to strip away all things complicated, hide all things specialized and obtuse. We distill things to the minimum needed and use descriptive images and simple language. People don’t care about linear regression, or what is the slope and intercept, they just want to see how many years they have left. So let’s make this as easy as possible. I came up with this minimal UI to enter age, country, and gender. Nothing to write or calculate, only three dropdowns and one button. The results are both in numerical and graphical forms. The image per-year-left also attempts to promote a healthy lifestyle :-)
Conclusion
People who would normally never have access to this kind of intelligence finally can. All that’s missing is a few good analysts willing to leverage simple tools like Python, Flask, the web, and the rampant worldwide availability of mobile phone browsers. Get your ideas out, your audience is waiting.