Let's Explore the Business Confidence Index (BCI) Together - Work-Progress with Python
Introduction
Lets Explore the Business Confidence Index Together (BCI). This is a powerful leading indicator. Im starting from scratch so you can follow along. MORE: Blog or code: http://www.viralml.com/video-content.html?fm=yt&v=tyhHK8qXtRk Signup for my newsletter and more: http://www.viralml.com Connect on Twitter: https://twitter.com/amunategui My books on Amazon: The Little Book of Fundamental Indicators: Hands-On Market Analysis with Python: Find Your Market Bearings with Python, Jupyter Notebooks, and Freely Available Data: https://amzn.to/2DERG3d Monetizing Machine Learning: Quickly Turn Python ML Ideas into Web Applications on the Serverless Cloud: https://amzn.to/2PV3GCV Grow Your Web Brand, Visibility & Traffic Organically: 5 Years of amunategui.github.Io and the Lessons I Learned from Growing My Online Community from the Ground Up: https://amzn.to/2JDEU91 Fringe Tactics - Finding Motivation in Unusual Places: Alternative Ways of Coaxing Motivation Using Raw Inspiration, Fear, and In-Your-Face Logic https://amzn.to/2DYWQas Create Income Streams with Online Classes: Design Classes That Generate Long-Term Revenue: https://amzn.to/2VToEHK Defense Against The Dark Digital Attacks: How to Protect Your Identity and Workflow in 2019: https://amzn.to/2Jw1AYS Transcript Business Confidence Index (BCI) https://data.oecd.org/leadind/business-confidence-index-bci.htm This business confidence indicator provides information on future developments, based upon opinion surveys on developments in production, orders, and stocks of finished goods in the industry sector. It can be used to monitor output growth and to anticipate turning points in economic activity. Numbers above 100 suggest increased confidence in near future business performance, and numbers below 100 indicate pessimism towards future performance. CATEGORY:Finance HASCODE:ViralML-Hands-On-Business-Confidence-Index-BCI.html
Code
from IPython.display import Image
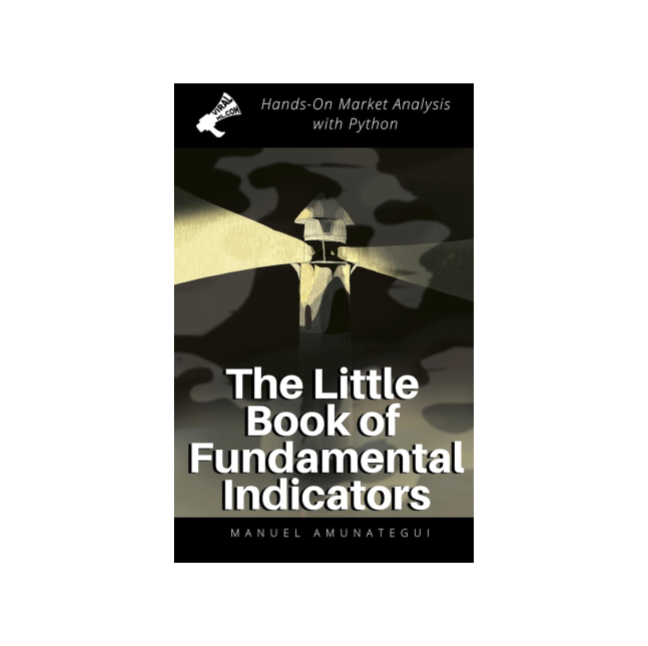
Image(filename='viralml-book.png')
Fundamental and Technical Indicators - Hands-On Market Analysis
Get the book: https://amzn.to/2DERG3d
More on: https://www.viralml.com/
Business Confidence Index (BCI)
https://data.oecd.org/leadind/business-confidence-index-bci.htm
This business confidence indicator provides information on future developments, based upon opinion surveys on developments in production, orders and stocks of finished goods in the industry sector. It can be used to monitor output growth and to anticipate turning points in economic activity. Numbers above 100 suggest an increased confidence in near future business performance, and numbers below 100 indicate pessimism towards future performance.
%matplotlib inline
import matplotlib
import matplotlib.pyplot as plt
import io, base64, os, json, re
import pandas as pd
import numpy as np
import datetime
import warnings
warnings.filterwarnings('ignore')
path_to_market_data = '/Users/manuel/Documents/financial-research/market-report/2019-07-02/'
Load Historical Data
bci_df = pd.read_csv(path_to_market_data + 'DP_LIVE_02072019085313431.csv')
bci_df = bci_df[bci_df['LOCATION'] == 'USA']
bci_df['Date'] = bci_df['TIME'] + '-01'
bci_df['Date'] = pd.to_datetime(bci_df['Date'])
bci_df = bci_df.sort_values('Date', ascending=True) # sort in ascending date order
bci_df = bci_df[['Date','Value']]
bci_df.columns = ['Date', 'BCI']
print(np.min(bci_df['Date'] ),np.max(bci_df['Date'] ))
bci_df.head()
sp500_df = pd.read_csv(path_to_market_data + '^GSPC.csv')
sp500_df['Date'] = pd.to_datetime(sp500_df['Date'])
sp500_df = sp500_df[['Date','Adj Close']]
sp500_df.columns = ['Date', 'SP500_Close']
print(np.min(sp500_df['Date'] ),np.max(sp500_df['Date'] ))
sp500_df = sp500_df.sort_values('Date', ascending=True) # sort in ascending date order
sp500_df.head()
Plot
fig, ax = plt.subplots(figsize=(16, 8))

plt.plot(bci_df['Date'], bci_df['BCI'], label='BCI', color='blue')
plt.legend(loc='upper right')
plt.grid()


# Get second axis
ax2 = ax.twinx()

plt.plot(sp500_df['Date'],  sp500_df['SP500_Close'], label='SP500_Close',color='black')
plt.legend(loc='upper left')
plt.show()
Let's zoom in
bci_df_tmp = bci_df.copy()
sp500_df_tmp = sp500_df.copy()

cut_off_date = '2007-01-01'
bci_df_tmp = bci_df_tmp[bci_df_tmp['Date'] >= cut_off_date]
sp500_df_tmp = sp500_df_tmp[sp500_df_tmp['Date'] >= cut_off_date]


fig, ax = plt.subplots(figsize=(16, 8))
plt.plot(bci_df_tmp['Date'], bci_df_tmp['BCI'], label='BCI', color='blue')
plt.legend(loc='upper right')
plt.grid()


# Get second axis
ax2 = ax.twinx()

plt.plot(sp500_df_tmp['Date'],  sp500_df_tmp['SP500_Close'], label='SP500_Close',color='black')
plt.legend(loc='upper left')
plt.show()
Let's Compare Different Countries
bci_df = pd.read_csv(path_to_market_data + 'DP_LIVE_02072019085313431.csv')
set(bci_df['LOCATION'])
bci_df = bci_df[bci_df['LOCATION'].isin(['USA','DEU'])]
bci_df['Date'] = bci_df['TIME'] + '-01'
bci_df['Date'] = pd.to_datetime(bci_df['Date'])
bci_df = bci_df.sort_values('Date', ascending=True)
bci_df = bci_df[['Date', 'Value','LOCATION']]
fig, ax = plt.subplots(figsize=(16, 8))

bci_df[bci_df['LOCATION']=='USA']['Date']


plt.plot(bci_df[bci_df['LOCATION']=='USA']['Date'],
         bci_df[bci_df['LOCATION']=='USA']['Value'], label='USA', color='blue')
plt.plot(bci_df[bci_df['LOCATION']=='DEU']['Date'],
         bci_df[bci_df['LOCATION']=='DEU']['Value'], label='DEU', color='green')
plt.grid()
plt.legend(loc='upper right')
Show Notes
(pardon typos and formatting -these are the notes I use to make the videos)
Lets Explore the Business Confidence Index Together (BCI). This is a powerful leading indicator. Im starting from scratch so you can follow along. MORE: Blog or code: http://www.viralml.com/video-content.html?fm=yt&v=tyhHK8qXtRk Signup for my newsletter and more: http://www.viralml.com Connect on Twitter: https://twitter.com/amunategui My books on Amazon: The Little Book of Fundamental Indicators: Hands-On Market Analysis with Python: Find Your Market Bearings with Python, Jupyter Notebooks, and Freely Available Data: https://amzn.to/2DERG3d Monetizing Machine Learning: Quickly Turn Python ML Ideas into Web Applications on the Serverless Cloud: https://amzn.to/2PV3GCV Grow Your Web Brand, Visibility & Traffic Organically: 5 Years of amunategui.github.Io and the Lessons I Learned from Growing My Online Community from the Ground Up: https://amzn.to/2JDEU91 Fringe Tactics - Finding Motivation in Unusual Places: Alternative Ways of Coaxing Motivation Using Raw Inspiration, Fear, and In-Your-Face Logic https://amzn.to/2DYWQas Create Income Streams with Online Classes: Design Classes That Generate Long-Term Revenue: https://amzn.to/2VToEHK Defense Against The Dark Digital Attacks: How to Protect Your Identity and Workflow in 2019: https://amzn.to/2Jw1AYS Transcript Business Confidence Index (BCI) https://data.oecd.org/leadind/business-confidence-index-bci.htm This business confidence indicator provides information on future developments, based upon opinion surveys on developments in production, orders, and stocks of finished goods in the industry sector. It can be used to monitor output growth and to anticipate turning points in economic activity. Numbers above 100 suggest increased confidence in near future business performance, and numbers below 100 indicate pessimism towards future performance. CATEGORY:Finance HASCODE:ViralML-Hands-On-Business-Confidence-Index-BCI.html


